Head Office
3555 - 14th Ave., Unit 18
Markham, ON L3R 0H5, Canada
Markham, ON L3R 0H5, Canada
Last Update: Apr 25, 2024
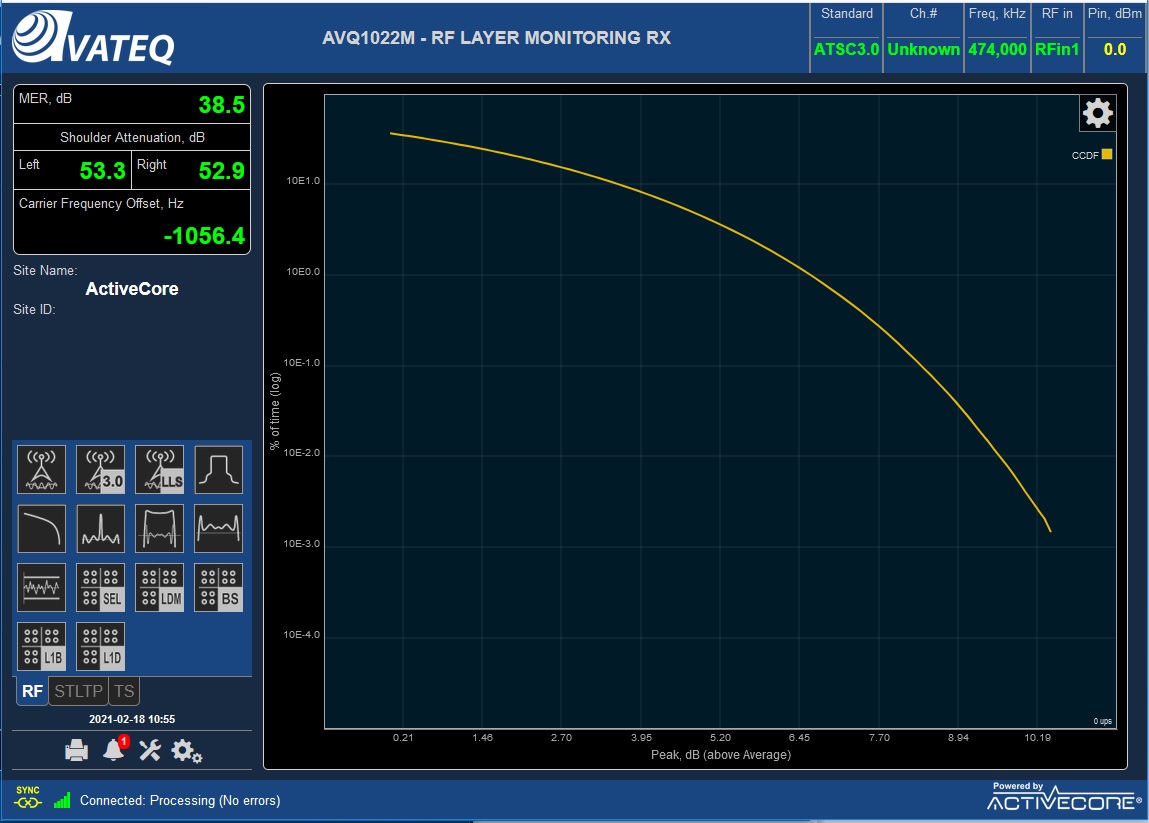
Signal Analysis - CCDF Plot
Web UI Icon

Supported Devices
Broadcast Standards
ATSC 1.0, ATSC 3.0, ISDB-T/Tb, DAB/DAB+, DTMB, DVB-S/S2
Availble Tools
- Markers
- Cross Bar
Screenshot

Description
A Complementary Cumulative Distribution Function (CCDF) plot displays how much time the signal "spends" at or above a power level. Plotted in percentage of time, the CCDF curve presents relative power levels versus probability. Since the modern digitally modulated signals might have significant Peak-to-Average-Power level, the CCDF curve can be used for estimation of the signal compression caused by the Amplifier.
