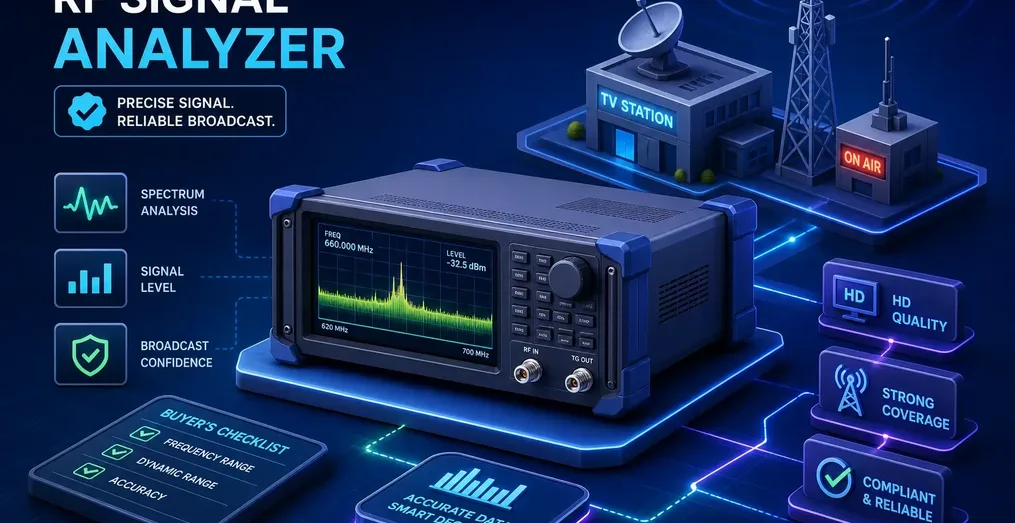
What is the best RF signal analyzer for a low-power TV or radio station? The answer depends on three things: which broadcast standards you transmit, whether you are measuring at the transmitter output coupler or off-air in the coverage area, and how far your capital budget can stretch. Most small, community, and regional stations in North America need a way to track channel power, occupied bandwidth, spectral emission masks, Modulation Error Ratio (MER), Bit Error Rate (BER), and multipath conditions without requiring a full-time RF specialist to interpret the screen.
For most low-power stations, the best analyzer is not the most expensive one on the market. It is the one that covers your standard, fits the point where you measure, and supports remote monitoring so you do not need a specialist on call every time a threshold alarm fires. This guide walks through the core technical and regulatory requirements for North American stations, how current broadcast economics affect test-equipment buying, and how to match your monitoring hardware to your site setup.
Key takeaways
- Baseline measurements: Channel power, occupied bandwidth, spectral mask (shoulder attenuation), MER, BER, link margin, and constellation displays are the core metrics every digital TV or radio station needs to watch.
- Spectrum analyzer vs. broadcast analyzer: A general-purpose spectrum analyzer shows RF power and interference. A dedicated broadcast analyzer adds digital demodulation, which is what tells you whether receivers can actually decode your signal.
- Capture bandwidth and dynamic range determine where the analyzer sits: Transmitter output shoulder and mask checks need an 18 MHz capture bandwidth with a deep spectrum floor (like the Avateq AVQ1020 or AVQ1022). Off-air monitoring and drive testing need a selective 6 MHz front end (like the AVQ200).
- Secondary-status compliance risk: Low-power TV and translator stations operate on a secondary basis under ISED BPR-10 in Canada and FCC Part 74 in the US. If filter drift or PA regrowth pushes your shoulders past the emission mask and causes interference, regulators can order an immediate shutdown.
- ATSC 3.0 and HD Radio require deeper demodulation: Bootstrap, L1 signaling, PLP link margin, and NRSC-5 sideband symmetry all need standard-specific demodulation.
- Remote access cuts down on truck rolls: SNMP, MQTT, email alarms, and a browser-based GUI let one engineer keep an eye on several remote sites without driving out for routine checks.
- Software-upgradeable hardware avoids a second purchase: In Canada, 87% of private conventional TV stations reported negative profit margins in 2025, so buying hardware that can be upgraded by license when you change standards avoids a second capital expense a few years down the road.
Why do equipment decisions matter more as station budgets tighten?
Small and regional broadcasters are buying test equipment under tight financial constraints, so every instrument has to justify its cost. The Canadian Association of Broadcasters' Broadcasting in Canada 2026 report, prepared by Communications Management Inc. (CMI) using Statistics Canada and CRTC figures, shows how steep those revenue drops have been. While the data comes from Canada, the day-to-day financial pressure looks much the same for independent TV and radio stations across the United States:
- Station revenue has fallen: Private conventional TV revenue in Canada dropped from $1.9 billion in 2015 to $1.3 billion in 2025. Over the same decade, private commercial radio fell from $1.6 billion to $1.1 billion.
- Most conventional TV stations are losing money: In 2025, 87% of private conventional TV stations reported negative profit margins. The sector lost more than $500 million that year (its largest single-year loss on record), bringing cumulative losses from 2016 to 2025 to roughly $2.73 billion ($2.4 billion on the CRTC's accounting basis).
- Ad spending has moved to digital platforms: Television's share of Canadian advertising fell from 31.5% in 2005 to 10.0% in 2025, and radio's share dropped from 13.7% to 4.2%. Over the same period, internet advertising grew from 5.9% to 79.7%.
- Cable and satellite cross-subsidies are shrinking: The share of Canadian households subscribing to cable or satellite TV fell from 80% in 2015 to an estimated 52% in 2025, reducing the specialty-channel revenue that used to help cover local over-the-air transmitter costs.
When budgets are that tight, stations cannot afford an analyzer that sits in a closet between site visits, requires a specialist to run, or has to be replaced the moment the station upgrades its exciter.
How do you choose the best RF signal analyzer for a small station?
Whether you run a low-power UHF/VHF TV transmitter, a chain of SFN gap-fillers, or an FM/HD Radio site, your monitoring setup needs to cover two areas: RF spectrum compliance and digital modulation quality.
Spectral compliance, shoulder attenuation, and capture bandwidth
Channel power, occupied bandwidth, emission mask checks, shoulder attenuation, and harmonic detection form the baseline for regulatory compliance:
- Channel power and occupied bandwidth confirm that your transmitter output is at its licensed level and staying inside its assigned channel (6 MHz for ATSC 1.0/3.0 TV, or 200–400 kHz for FM and hybrid HD Radio).
- Spectral mask and shoulder attenuation measurements catch power amplifier (PA) non-linearity, intermodulation regrowth, and mask filter drift. Under ISED BPR-10 in Canada and 47 CFR § 74.794 in the US, low-power TV and translator stations must meet Simple, Stringent, or Full-Service emission masks (measured in a 500 kHz reference bandwidth). These masks require attenuation of 46 dB to 47 dB right at the channel edge, sloping down to 71 dB (Simple mask at ±6 MHz), 76 dB (Stringent mask beyond ±3 MHz), or 110 dB (Full-Service mask beyond ±6 MHz).
- Why front-end bandwidth and dynamic floor matter (6 MHz vs. 18 MHz): An off-air monitoring receiver uses a tight 6 MHz channel filter to block strong adjacent channels and achieve deep receive sensitivity (−90 dBm), making it ideal for off-air supervision and drive testing, but not for transmitter output shoulder checks. Conversely, a dedicated transmitter output monitor captures an 18 MHz bandwidth down to a −80 dB spectrum floor, which covers the entire Simple (−71 dB) and Stringent (−76 dB) emission masks used by low-power TV stations across the adjacent channels, as well as the Full-Service mask down to −80 dB (only the deepest −80 dB to −110 dB outer skirt of a Full-Service mask requires a notched bench spectrum analyzer).
Digital modulation quality and error metrics
A transmitter can look completely normal on a spectrum trace and still fail to decode on consumer sets in the field. Modulation analysis tells you what is actually happening inside the waveform:
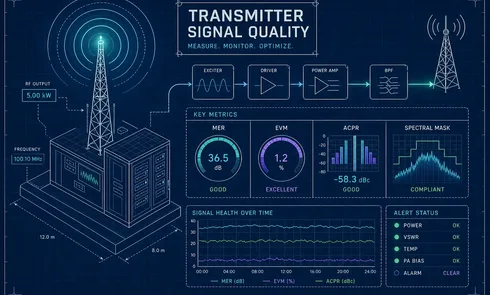
- Modulation Error Ratio (MER) and Error Vector Magnitude (EVM) measure how far each symbol strays from its ideal position due to phase noise, PA compression, I/Q imbalance, or in-band interference. Because MER drops gradually well before a digital signal hits the "cliff effect," watching MER trends gives you early warning of an aging exciter or a failing cooling fan.
- Bit Error Rate (BER) and Packet/Frame Error Ratio track decoding errors before and after forward error correction (Viterbi and Reed-Solomon in ATSC 1.0, or LDPC and BCH in ATSC 3.0).
- In-band interference detection and constellation displays help you spot specific faults, such as phase jitter, amplitude compression, or co-channel interference sitting underneath the carrier, without guesswork.
- Peak-to-Average Power Ratio (PAPR) and CCDF curves show signal crest factors so you can set amplifier backoff properly and confirm that pre-distortion circuits are holding linearity.
Do you need a spectrum analyzer or a dedicated broadcast signal analyzer?
A general-purpose spectrum analyzer measures RF power against frequency. It is the right tool when you are hunting external interference, sweeping a cavity filter on the bench, or checking harmonic levels. What it cannot do is demodulate a digital TV or radio waveform. Faults in the exciter's I/Q modulator, corrupted ATSC 3.0 L1 signaling tables, an unlocked 8VSB pilot, or uncompensated multipath echoes will not show up on a standard spectrum trace.
A dedicated broadcast signal analyzer combines RF spectrum measurements with physical-layer demodulation. Instead of just showing that RF energy is present in the channel, it tells you whether receivers in your coverage area can actually lock onto and decode the broadcast. If the question is "what is occupying this channel?", a spectrum analyzer is the right tool. If the question is "can a normal receiver lock and decode this signal correctly?", you need a broadcast-capable analyzer.
Does ATSC 1.0, ATSC 3.0, or HD Radio support matter for your station?
For North American broadcasters, analyzer requirements center on three over-the-air standards:
- ATSC 1.0 (8VSB): Defined by ATSC A/53, ATSC 1.0 monitoring requires 8VSB-specific measurements: pilot tone level, MER/SNR across the 6 MHz channel, pre- and post-Viterbi/Reed-Solomon BER, carrier frequency offset, shoulder attenuation, and time-domain echo profiles to catch reflections or feedline issues.
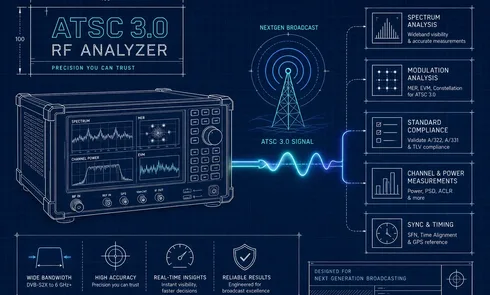
- ATSC 3.0 (NextGen TV): ATSC 3.0 uses an OFDM physical layer defined by ATSC A/321 and ATSC A/322. Because LPTV stations in the US are allowed to flash-cut directly to ATSC 3.0 without simulcasting, many low-power operators are moving early into NextGen TV datacasting and single-frequency networks (SFNs). Monitoring ATSC 3.0 requires Bootstrap validation, L1-Basic and L1-Detail signaling checks, per-PLP MER, BER, and Link Margin estimation, OFDM shoulder monitoring, SFN echo profiling, and Transmitter ID (TxID) decoding.
- HD Radio (FM IBOC): For radio stations running hybrid or all-digital HD Radio under NRSC-5 (ISED BPR-3 and FCC Part 73), the analyzer needs to measure upper and lower digital sideband levels and symmetry, verify the NRSC-5 spectral emission mask, track MER per digital partition, and display in-band interference Power Spectral Density (PSD) underneath the digital sidebands.
- Worldwide standard support (Europe, Australia, and international networks): Because software-defined analyzers like the Avateq AVQ200 process waveforms in programmable hardware, the same unit can also be licensed for standards used outside North America, including DAB+ in Europe and Australia, and ISDB-T/Tb in Latin America and Japan.
What budget tier fits your station's monitoring needs?
Broadcast RF test and monitoring gear generally falls into three categories:
- Entry-level USB dongles and SDRs ($100–$1,000): Inexpensive SDRs can confirm that a carrier is on the air and show rough spectrum shapes, but they lack RF front-end preselection, dynamic range, and calibrated broadcast demodulation. Strong signals at a transmitter site easily overload their front ends, producing internal intermodulation that looks like transmitter shoulder regrowth.
- Bench spectrum analyzers and handheld installation meters ($2,500–$14,000+): Entry-level benchtop spectrum analyzers are handy in the shop for filter alignment, while battery-powered handheld TV meters are built for short antenna alignment jobs. However, handheld meters are not meant to be left plugged in 24/7 on a transmitter rack; their internal lithium batteries degrade under constant trickle charging, and they rarely include the headless SNMP/MQTT server features needed for unattended remote sites.
- Purpose-built broadcast monitoring receivers and analyzers (portable and 1U rack): Solid-state, battery-free broadcast analyzers are built to run continuously for years with embedded web and network telemetry. They come in two broad classes depending on whether you monitor the off-air signal or the transmitter output coupler, covered in the next section.
Why do remote access and ease of use matter more than specs for lean teams?
Many low-power TV and radio stations share one contract or regional engineer across several transmitter sites. If an analyzer cannot send alarms, log historical data, or open in a standard web browser, every question about signal quality turns into a trip to the site. Four features make day-to-day remote operation practical:
- SNMP and MQTT support: SNMP lets your existing remote control or NOC system poll the analyzer and receive traps when MER, link margin, or signal level crosses a preset limit. MQTT uses a lightweight publish-subscribe protocol that works well over cellular modems with limited bandwidth or high latency.
- Email threshold alerts: Direct email notifications when RF power, frequency offset, or MER drifts out of spec, so you can plan maintenance before viewers or listeners lose the station.
- Onboard data logging: Internal storage that logs RF and modulation parameters locally (along with GPS coordinates during mobile tests), allowing you to review intermittent overnight or weather-related faults even if the site's internet connection drops.
- Browser-based Web GUI: A built-in web interface that opens in a normal browser over your site network or VPN without proprietary client software, with clear threshold indicators that non-specialist staff can check at a glance.
How do Avateq's analyzers fit where you measure?
Match both the analyzer's RF capture bandwidth and its dynamic range floor to where it connects in the RF chain. Avateq builds two hardware classes, designed, built, and supported in Markham, Ontario. Full specifications for each model are on its product page.
Off-air monitoring and drive testing
The AVQ200 RF Signal Inspector, built on Avateq's ActiveCore® mobile receiver platform, filters the incoming signal to a 6 MHz channel bandwidth. That rejects strong adjacent channels and reaches −90 dBm sensitivity, which suits 24/7 off-air and translator monitoring. Because it runs on 12V DC and logs GPS coordinates alongside signal quality, the same unit also works as a vehicle-powered drive-test receiver, so stations avoid a second equipment purchase for field work.
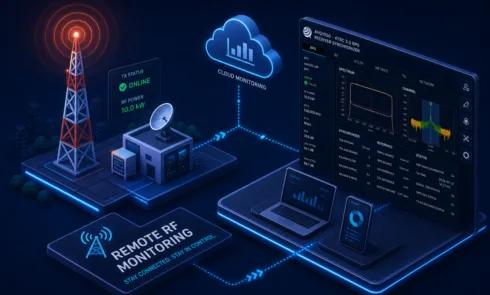
- Unattended monitoring: Built-in Web GUI, SNMP traps, MQTT telemetry, and email alarms over Gigabit Ethernet.
- Standards: ATSC 1.0, ATSC 3.0 (Bootstrap, L1-Basic, L1-Detail, per-PLP MER, SFN echo profiles, TxID), and HD Radio sideband symmetry, with DAB+ and ISDB-T/Tb available by software license.
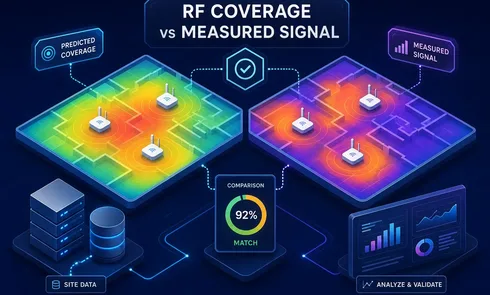
- Coverage verification: After a drive test, drop the exported log into the free, browser-based Avateq Logreader. It plots measured RF level (dBm), MER, and reception quality on a synchronized map and timeline next to predicted coverage from Free-Space Path Loss (FSPL) and terrain-aware ITM (Longley-Rice) models, using a built-in US and Canadian station database. (Logreader Version 4 will also add interference analysis and additional coverage tools.)
Because the 6 MHz filter rolls off energy outside the channel edges, the AVQ200 is not the right tool for measuring out-of-band shoulders at a transmitter directional coupler.
Transmitter output and mask monitoring
The AVQ1020 installs in a 1U rack at the transmitter site and connects to the transmitter's RF sample ports (before and after the mask filter). It captures an 18 MHz bandwidth down to a −80 dB spectrum floor. Under FCC § 74.794 and ISED BPR-10, low-power TV and translator stations typically operate under either the Simple Mask (−46 dB at the channel edge sloping to −71 dB at ±6 MHz) or the Stringent Mask (−47 dB in the first 500 kHz sloping to −76 dB beyond ±3 MHz). A −80 dB floor has the dynamic range to monitor full compliance with both, plus pre- and post-filter bandpass performance. Only the outer skirt of a Full-Service Mask, which continues down to −110 dB at ±6 MHz, requires a notched bench spectrum analyzer.
For engineers who want transmitter output monitoring and off-air reception monitoring in a single analyzer, the AVQ1022 (1U rackmount) and AVQ1022M (portable mobile box) combine two independent RF chains: an 18 MHz chain with dual switched inputs for pre- and post-filter comparison, and a 6 MHz, −90 dBm chain (similar to the AVQ200) connected to an external receive antenna. See the AVQ1022 datasheet (PDF) for full details.
| Model | Best for | Where it connects |
|---|---|---|
| AVQ200 | 24/7 off-air monitoring and mobile GPS drive testing | Off-air receive antenna (6 MHz, −90 dBm sensitivity) |
| AVQ1020 | Fixed transmitter output, mask, and filter monitoring (1U rack) | Transmitter RF sample ports (18 MHz, −80 dB floor) |
| AVQ1022 / AVQ1022M | Transmitter output and off-air monitoring in one unit (1U rack or mobile) | Both: 18 MHz transmitter chain plus 6 MHz off-air chain |
What is the best RF signal analyzer for your station? Making the right call
Most small and regional stations fall into one of three situations:
- Needing 24/7 off-air monitoring and occasional field coverage proofs: Rather than splitting a limited budget between a handheld meter and a fixed receiver, use the compact AVQ200 to monitor your off-air signal full-time and move it into a vehicle whenever you need to map real-world coverage with the Avateq Logreader.
- Needing continuous transmitter output and mask filter compliance: If you want visibility into your transmitter's spectral shoulders, Simple or Stringent emission mask compliance, and pre/post-filter performance, step up to the 1U AVQ1020, or choose the dual-chain AVQ1022 / AVQ1022M to monitor the transmitter output and an off-air receive antenna in the same unit.
- Planning for ATSC 3.0 (NextGen TV): Choose hardware that can be software-licensed for ATSC 3.0 Bootstrap/L1 decoding, per-PLP MER, and Link Margin estimation so you do not have to buy a second analyzer when you upgrade your plant.
If you would like to see how these analyzers fit your transmitter sites, get in touch with our team. You can also try the Avateq Logreader online to see how drive-test logs compare against propagation models.
Frequently asked questions
What is the minimum set of measurements a low-power TV or radio station in North America needs from an RF analyzer?
For ATSC 1.0, you need channel power, occupied bandwidth, spectral mask (shoulder attenuation), pilot level, MER, pre- and post-Viterbi BER, constellation display, and echo profile. For ATSC 3.0, add Bootstrap (ATSC A/321) and L1-Basic/L1-Detail (ATSC A/322) validation, per-PLP MER and Link Margin estimation, PAPR/CCDF, and SFN echo profiling. For HD Radio (IBOC), look for upper and lower digital sideband symmetry, NRSC-5 mask compliance, partition MER, and in-band interference PSD.
Can a general-purpose spectrum analyzer replace a broadcast signal analyzer?
Not for digital modulation troubleshooting. A spectrum analyzer measures power versus frequency, which works well for finding external interference or checking harmonic filters, but it cannot demodulate a digital TV or HD Radio waveform. It will not flag corrupted L1 signaling, low MER, reduced link margin, phase noise, I/Q imbalance, or in-channel multipath echoes that prevent consumer receivers from locking.
Can one instrument reliably handle both 24/7 off-air site monitoring and mobile drive testing?
Yes, as long as it uses solid-state embedded hardware rather than a battery-powered handheld meter. Handheld meters have internal batteries and thermal limits that wear out when left on a shelf plugged in 24/7. The AVQ200 has no internal battery to degrade, runs continuously from 0 °C to 50 °C with built-in SNMP, MQTT, and Web GUI access, and runs on 12V DC in a vehicle when you need to run a field test, logging GPS coordinates alongside signal quality parameters.
How do SNMP and MQTT help at remote sites running on cellular modems?
Remote repeaters often use LTE/5G routers with capped data plans. SNMP traps and email alerts send short packets only when a measurement crosses a threshold, and MQTT uses a lightweight publish-subscribe connection that stays reliable over high-latency or low-bandwidth cellular links without constant heavy polling.
What causes digital sideband asymmetry on an FM HD Radio transmitter?
On an NRSC-5 FM IBOC signal, the upper and lower digital sidebands should sit at equal power relative to the analog carrier. If one sideband is noticeably higher or lower than the other, it usually points to bandpass tilt in the antenna or combiner, high VSWR, or intermodulation in the transmitter PA.
Do I need ATSC 3.0 support if my station is still on ATSC 1.0?
If you expect to transition or test ATSC 3.0 within the next two to four years, buying a software-upgradeable platform saves you from buying a second analyzer later. You can monitor 8VSB now and unlock ATSC 3.0 via software license when your transition starts. The same applies if your organization works internationally, since the AVQ200 can also be licensed for DAB+ (used in Europe and Australia) and ISDB-T/Tb (used in Latin America and Japan).
How can I tell whether a reception complaint is caused by the transmitter or by local terrain?
Check your site analyzer first to confirm that transmitter power, MER, and link margin look normal. If the transmitter output is clean, take the AVQ200 out for a GPS drive test through the complaint area and load the file into the Avateq Logreader. Comparing your measured log against the ITM (Longley-Rice) terrain prediction will show whether the drop in signal matches a terrain shadow, heavy tree cover, or an antenna pattern issue.
Sources and technical references
- Canadian Broadcast Sector Economics: Communications Management Inc. (CMI), prepared for the Canadian Association of Broadcasters (CAB), Broadcasting in Canada 2026. Underlying financial, advertising, and household subscription data from Statistics Canada and the CRTC.
- Canadian Broadcast Spectrum & Equipment Rules (ISED): Innovation, Science and Economic Development Canada, BPR-10: Application Procedures and Rules for Digital Television (DTV) Undertakings, BPR-3: Application Procedures and Rules for FM Broadcasting Undertakings, and BETS-1: Technical Standards and Requirements for Low Power Announce and FM Transmitters.
- U.S. Low-Power TV & Translator Regulations (FCC): Electronic Code of Federal Regulations, 47 CFR Part 74 Subpart G (Low Power TV, TV Translator, and TV Booster Stations), including § 74.794 (DTV out-of-channel emission masks) and 47 CFR Part 73 (§ 73.317 / § 73.404 for FM and IBOC digital radio emission limits).
- ATSC Digital Television Standards: Advanced Television Systems Committee, ATSC A/53: ATSC Digital Television Standard (8VSB), ATSC A/321: System Discovery and Signaling (Bootstrap), and ATSC A/322: Physical Layer Protocol (ATSC 3.0).
- North American Digital Radio Standard (HD Radio): National Radio Systems Committee, NRSC-5-E: In-Band/On-Channel Digital Radio Broadcasting Standard.
- Avateq Product Specifications: AVQ200 RF Signal Inspector (ActiveCore® Mobile Platform), AVQ1020 (2nd Gen), AVQ1022 1U (2nd Gen), AVQ1022M Mobile (2nd Gen), AVQ1022 Datasheet (PDF), and Avateq Logreader Web Application.