An ATSC 3.0 transmitter can be running at full rated power, with no alarms on the exciter and no alerts from the plant, while four critical numbers are quietly sliding toward failure. Signal level looks fine. The engineer on duty has no reason to pull the car over. But viewers at the fringe of your coverage area are already losing signal.
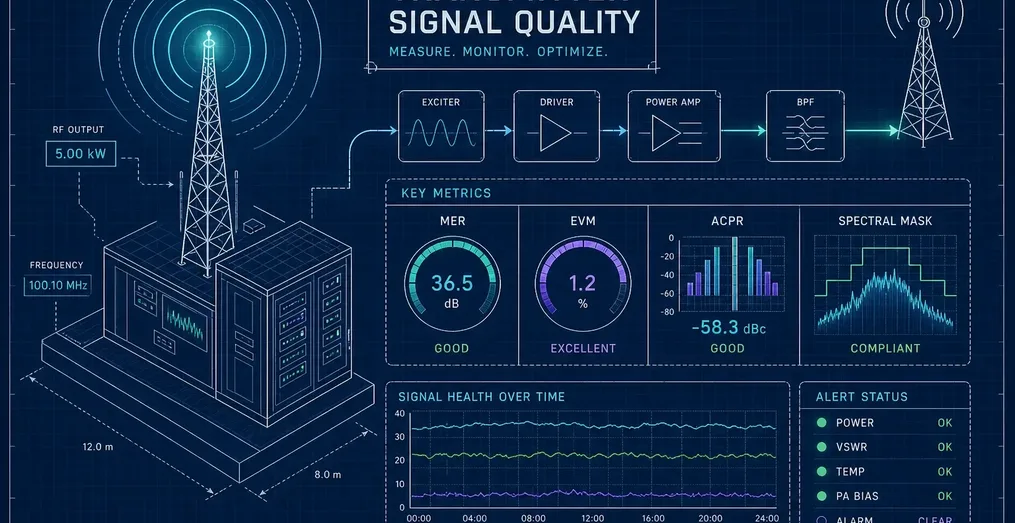
The four numbers that matter are MER, BER, PAPR, and signal level. Each one measures a different layer of transmitter performance, and none of them tells the full story on its own. Understanding what each metric represents, what the thresholds mean in practice, and how the four interact is the foundation of professional ATSC 3.0 station management. Modern analyzers surface all four simultaneously in real time, which means broadcast engineers or NOC teams can act on a trend rather than react to a complaint.
Why ATSC 3.0 Raises the Bar on Signal Quality Standards
ATSC 1.0's 8VSB modulation is a single-carrier system. When something goes wrong in the transmitter chain, the impairment affects a single signal in a relatively straightforward way. ATSC 3.0's OFDM architecture splits your signal across thousands of subcarriers simultaneously, and that changes everything about how transmitter impairments behave. A phase noise event, a PA nonlinearity, or a clipping condition doesn't hit one carrier, it spreads across the entire multiplex, degrading MER across all subcarriers at once in ways that 8VSB never exposed.
A quick power check was enough in the ATSC 1.0 era because RF output power correlated reasonably well with signal quality. In a NextGen TV plant, that same check misses the most important failure modes entirely. RF power output can look completely normal while MER is already degrading and pre-FEC BER is climbing, because the problem is in modulation accuracy or PA linearity, not in average output power.
What Makes OFDM More Sensitive to Transmitter Impairments
OFDM's multi-carrier structure means that phase noise, clipping, and PA nonlinearity create inter-carrier interference across all subcarriers at once. In an 8VSB system, PA compression mostly shows up as amplitude distortion on a single channel. In an OFDM system, the same compression generates intermodulation products that land on adjacent subcarriers within the multiplex, directly destroying MER. The mechanism is different, and the monitoring requirements follow directly from that difference.
The Compliance Picture Under NextGen TV
The FCC's framework for ATSC 3.0 requires that stations maintain comparable OTA service quality throughout and after the transition. That means your transmitted signal needs to cover the same area your DTV signal covered, at a modulation and coding combination that can be decoded at equivalent SNR thresholds. Ad-hoc monitoring, where an engineer spot-checks metrics once a week, doesn't give you the continuous data trail you need to demonstrate compliance or to catch a slow-moving degradation before it becomes a coverage problem.
MER: The Number That Defines Your Modulation Health
MER, Modulation Error Ratio, is the single most informative metric in your ATSC 3.0 monitoring stack. It measures how accurately your transmitter places constellation points relative to their ideal positions in the signal space. A high MER means your receiver has plenty of margin to decode correctly even under marginal reception conditions. A declining MER trend is one of the earliest signs that something in the exciter, PA chain, or combining network is introducing error into the signal.
How MER Is Calculated and What It Represents Physically
MER is the ratio of ideal signal power to error vector power, measured at the symbol level across the OFDM constellation, essentially the signal-to-noise ratio of your modulation accuracy. When every symbol lands exactly where it should, MER is high. When PA nonlinearity compresses outer constellation points, or phase noise rotates symbols off their ideal positions, MER drops. The ATSC 3.0 standard defines a transmitter MER compliance target of at least 27 dB, measured at the transmitter output.
MER Thresholds Across ATSC 3.0 Modulation and Coding Combinations
Higher-order constellations demand more from your transmitter chain. A QPSK mode can be decoded at received SNR thresholds as low as a few dB, which means it carries substantial margin against MER degradation. A 4096-QAM mode requires the receiver to distinguish between thousands of closely spaced constellation points, demanding significantly higher sustained MER at the transmitter. The 27 dB compliance floor specified in ATSC A/322 is the transmitter's responsibility; the choice of modulation and code rate then sets how much margin the receiver gets over whatever path loss exists between your antenna and the viewer's set.
What a Declining MER Trend Tells You About the Transmitter
Different MER degradation patterns point to different root causes. PA nonlinearity and clipping show up as MER degradation that correlates with higher PAPR events, and the worst degradation tends to appear on the outer constellation points first. Phase noise from an unstable local oscillator smears the constellation uniformly across all subcarriers, producing a floor on MER that persists regardless of signal level.
Thermal drift typically produces a gradual MER decline over hours, the kind of slow-moving fault that a morning spot check will miss entirely. I/Q imbalance in the exciter or modulator creates an elliptical or skewed constellation pattern that is visible in the constellation display and shows up as a sustained MER offset even when every other metric looks correct. Each signature is distinct enough to guide your next diagnostic step.
BER: Your Earliest Warning Before Viewers Lose Signal
BER, Bit Error Rate, measures how many bits arrive at the decoder incorrectly. In ATSC 3.0, the relevant distinction is between pre-FEC BER, the error rate before the LDPC/BCH forward error correction processes the stream, and post-FEC BER, which is the error rate after FEC has done its work. Both numbers matter, but they tell you different things about the health of your link.
Pre-FEC BER vs. Post-FEC BER: What Each One Reveals
Pre-FEC BER tells you how hard the FEC is working. When pre-FEC BER is low, the FEC has minimal correction burden and post-FEC BER will be clean. As pre-FEC BER rises, the FEC is correcting more errors per unit time, and its ability to sustain a clean output is being consumed. A rising pre-FEC BER is a warning sign even when post-FEC BER is still showing zero errors. Engineers who watch only post-FEC BER are watching the wrong number until it's too late to react.
BER Thresholds That Separate Performance from Failure
For ATSC 3.0, the practical pre-FEC BER operating range runs roughly from 10-3 to 10-8 depending on signal conditions and modulation mode. Post-FEC BER targets for quasi-error-free service are typically at or better than 10-6 after correction. When post-FEC BER climbs above that threshold, errors are no longer being fully corrected and viewer impact is imminent. From a service quality standpoint, the link is effectively in failure at that point.
How BER and MER Degradation Sequence Together
The sequence is predictable and useful for diagnosis. MER degrades first, because the transmitter is generating imperfect symbols before the receiver even tries to decode them. Pre-FEC BER rises in response, as more symbols land outside their ideal decision boundaries. Once pre-FEC BER climbs high enough to overwhelm the FEC's correction capacity, post-FEC BER starts to climb as well, and at that point, the receiver fails to decode reliably and viewer impact begins. Reading all three numbers in sequence gives you a timeline that guides root-cause diagnosis faster than any single metric alone.
PAPR and Signal Level: The Metrics That Stress Your Hardware Chain
PAPR, Peak-to-Average Power Ratio, and signal level are often treated as background metrics rather than primary diagnostic tools. That's a mistake. Both directly drive MER and BER outcomes, and each one catches a class of failure that the other metrics can miss entirely.
What PAPR Does to Your Power Amplifier and Why It Matters in OFDM
ATSC 3.0's OFDM signal carries a typical PAPR of 8, 9 dB under normal operating conditions, with PAPR reduction techniques like Tone Reservation and Active Constellation Extension available to help manage peaks. The problem is that your power amplifier must handle the highest instantaneous peaks in the waveform without compressing or clipping them, while still operating at the much lower average power of the OFDM signal. When peaks push the PA into its nonlinear region, the result is intermodulation distortion that lands directly across your subcarriers and destroys MER. More PA backoff cleans up the signal but reduces efficiency; insufficient backoff creates spectral regrowth and modulation quality problems that show up immediately in MER. Shoulder attenuation (out-of-channel intermodulation products relative to the in-band signal, sometimes expressed as ACPR) is the direct measurement of that regrowth. It's also what the FCC emission mask is measured against, so a shrinking shoulder margin is both a MER problem and a compliance problem.
Signal Level Monitoring as a First-Line Health Check
Signal level measurement catches a different class of problems: insufficient drive to the exciter, antenna system degradation, gradual output drift over time, and combiner loss. None of those failure modes necessarily appear in MER or BER during the early stages of the fault. A slow drop in signal level over 48 hours points to an output path problem, not a modulation quality problem, and tracing the fault requires knowing that signal level is the anomaly rather than MER or BER.
Signal level tells you that the output path has changed; it doesn't tell you where. When the analyzer is fed from the transmitter output sample port, the CIR (Channel Impulse Response) echo profile fills that gap. A reflection from a feeder line fault or antenna mismatch shows up as an echo at a fixed delay after the main signal, and the delay converts directly to a distance down the line. That lets you estimate reflected energy and localize the mismatch from the same measurement, without waiting for a reflected-power alarm on the transmitter or a truck roll to sweep the line.
How PAPR and Signal Level Connect Back to MER and BER
The cause-and-effect chain is direct. Elevated PAPR pushes the PA into nonlinear operation, which shows up in MER first and in BER shortly after. Drifting signal level reduces the receiver's SNR margin, which also degrades MER before it affects BER. When you're reading all four metrics together, the order in which they change points you toward the fault: PAPR-driven problems implicate the PA and the signal chain ahead of it, while signal level anomalies implicate the antenna system and output path. Reading the combination shortens troubleshooting time significantly.
Reading All Four Metrics Together: What the Patterns Actually Mean
Each metric in isolation is limited. The real diagnostic value comes from reading MER, BER, PAPR, and signal level as a system. Specific failure types leave recognizable signatures across all four numbers, and recognizing those signatures lets you move from "something is wrong" to "here's where to look" without guessing.
A Practical Metric-to-Fault Mapping Framework
High PAPR combined with degraded MER and rising pre-FEC BER is characteristic of PA nonlinearity or clipping. The PA is being pushed into compression by instantaneous signal peaks, generating intermodulation that destroys modulation accuracy. Stable PAPR with a dropping signal level and rising post-FEC BER suggests a downstream path problem: antenna system degradation, connector loss, or a combiner fault. Stable PAPR and stable signal level with a steady MER decline that doesn't correlate with power changes often indicates an exciter or phase noise problem. Each pattern is distinct enough to narrow the fault class quickly.
Why Trends Matter More Than Single-Point Readings
A single snapshot of each metric can look perfectly acceptable while a trend over 24, 48 hours reveals the early stages of degradation. A PA beginning to degrade thermally may show normal MER at 6 a.m. and marginal MER at 2 p.m. after hours of full-power operation. A spot check during morning hours misses the problem entirely. Continuous monitoring is the only way to catch slow-moving failures before they become viewer-impacting events. Trend data also provides the documentation trail you need for FCC compliance purposes if a performance question ever arises.
Common Diagnostic Mistakes Engineers Make With These Metrics
The most tempting assumption is that a clean post-FEC BER means everything is fine. It doesn't, it means the FEC is currently holding. A pre-FEC BER that has tripled over the past 12 hours is a problem, even if post-FEC BER still shows zero. PAPR is similarly easy to dismiss because it looks typical on the spec sheet, but it's a statistical measure: instantaneous peaks that exceed the PA's linear headroom can be brief enough to miss on a casual check yet frequent enough to degrade MER over time. Treating a single MER dip as the whole story is the third error engineers tend to make. A momentary dip from an external RF event is fundamentally different from a three-day declining trend, and conflating the two leads to either false alarms or missed faults.
Real-Time Monitoring: Catching Signal Degradation Before It Reaches a Viewer
Knowing what the four metrics mean only helps if you're watching them continuously. Reactive monitoring, where the engineering team checks signal quality after a viewer complaint arrives, is always too late. By the time a complaint is filed, processed, and investigated, the signal may have been degraded for hours. The operational answer is automated, threshold-based alerting on a continuous monitoring platform.
Why Reactive Monitoring Is Always Too Late in Broadcast Operations
Viewer complaints are a lagging indicator of signal degradation, not a leading one. A viewer at the fringe of your coverage area loses signal before a viewer near the tower does, and most viewers don't report signal problems, they change channels. By the time your station receives actionable feedback, the event that caused the degradation may have developed further or may have cleared itself, leaving only a logged metric history to explain what happened. Automated alerting on metric thresholds is the only practical answer for always-on transmitter oversight.
What Avateq's ATSC 3.0 Analyzers Show You in Real Time
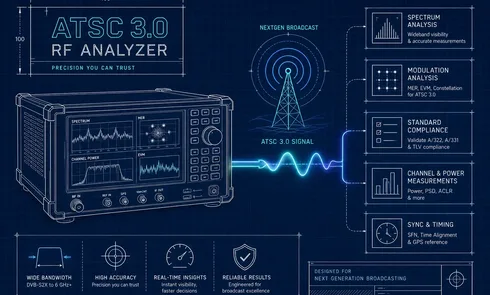
Avateq Corp.'s ATSC 3.0 signal analyzers provide a web-based dashboard that displays MER, BER, PAPR with shoulder attenuation, signal level, and the CIR echo profile simultaneously in real time, accessible remotely for all levels of technical support - from a station engineer or a regional manager to the NOC teams managing multiple transmitter sites. The platform supports continuous multi-metric logging and integrates with existing automated monitoring workflows and network management systems via SNMP and MQTT protocol support, no custom development required. Configurable per-metric alert thresholds let you define exactly where the system flags a declining MER trend or a rising pre-FEC BER, delivering a complete transmitter signal quality picture across all four key metrics from any browser at any site in the network.
Configuring Alerts and Logging for Compliance Documentation
Threshold-based alerts notify the right people immediately when a metric crosses a defined boundary, via email alerts or SNMP traps, before conditions escalate to a compliance event or viewer impact. Internal logging captures metric history for offline analysis, providing the time-stamped performance record needed for FCC compliance documentation or post-incident review. For NOC teams managing sites without on-site staff, that combination of real-time alerting and historical logging handles a large percentage of diagnostic situations without requiring a truck roll.
Putting It All Together
Transmitter signal quality in an ATSC 3.0 plant comes down to four numbers: MER, BER, PAPR, and signal level. None of them tells the complete story alone. MER shows you modulation accuracy but doesn't distinguish between a PA problem and a phase noise problem without supporting data. BER shows you the link's stress level but only after MER has already changed. PAPR and signal level provide the context that separates hardware chain failures from modulation quality problems.
The value is in reading all four continuously and watching their trends together. A single spot check on any one of them gives you a point in time. A continuous trend across all four gives you a diagnostic picture that points directly to the fault class, often hours before viewer impact occurs. That's the difference between maintaining a compliant, reliable signal transmission and managing a reactive cycle of complaints and troubleshooting.
Avateq Corp.'s AVQ1020 - RF Layer Monitoring Receivers and AVQ1022 - RF Signal Analyzers deliver that continuous, multi-metric visibility across every site in the network. For engineers transitioning to ATSC 3.0 or evaluating an upgrade to their transmitter monitoring stack, Avateq publishes detailed analyzer specifications and demo scheduling at avateq.com.